Image Details
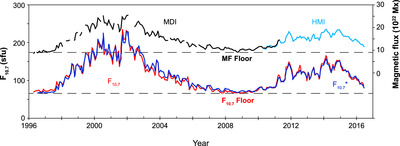
Caption: Figure 1.
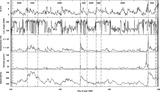
Upper curve: MDI line of sight (LOS) magnetic flux (MF; black) scaled to match the HMI LOS MF (light blue) based on their overlap. Lower curves: observed F 10.7 flux reduced to 1 au (red) and F 10.7* (dark blue), computed from the magnetic flux of the composite record. All curves have a 1 month resolution. (Adapted from Svalgaard & Sun 2016.)
Other Images in This Article

Copyright and Terms & Conditions
© 2024. The Author(s). Published by the American Astronomical Society.
Copyright ©
2025 Astronomy Image Explorer. All Rights Reserved.