Image Details
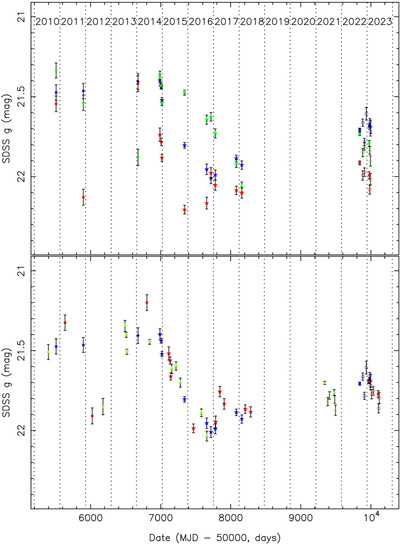
Caption: Figure 4.
Top: the light curves of the quasar images A (blue), B (green), and C (red). The data points are aperture-photometry from Pan-STARRS (filled circles), DECaLS (filled stars), the Magellan Telescopes (filled squares), and the Nordic Optical Telescope (open circles). Bottom: the light curves for images B and C are shifted relative to image A by Δt AB = 499 and Δt AC = −127 days, the predicted time delays from the best-fit lens model. The data points of images B and C were then shifted vertically by 0.03 and 0.22 mag, respectively, to align with the light curve of image A (see Section 6).
Other Images in This Article
Copyright and Terms & Conditions
© 2023. The Author(s). Published by the American Astronomical Society.