Image Details
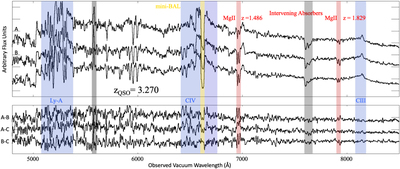
Caption: Figure 2.
LDSS3-C spectra of the three quasar images of COOL J0335−1927. The spectra are vertically offset for clarity, with the top, middle, and bottom spectra corresponding to images A, B, and C, respectively. The gray shaded regions indicate major telluric and night sky features. The C III blue region was used to derive the systemic redshift. The system is classified as a “mini”-BAL quasar based on the broad and nearly opaque absorption seen redshifted relative to systemic at C IV. The red shaded regions indicate a Mg II absorption feature used to identify intervening absorbers at z = 1.486 (see also Figure 1) and at z = 1.829. The bottom panel shows the difference spectra of the three pairs of quasar images. The difference spectra are consistent with the noise. Future work will investigate any differences in the quasar spectra resulting from variability or line-of-sight differences due to intrinsic and intervening absorption.
Other Images in This Article

Copyright and Terms & Conditions
© 2023. The Author(s). Published by the American Astronomical Society.