Image Details
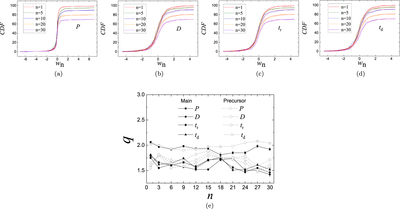
Caption: Figure 2.
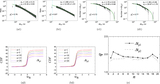
The CDFs of the size differences of precursors. Panels (a)–(d) show the size difference distributions of peak fluxes (P), durations (D), rise times (t r ), and decay times (t d ) for n = 1 (red), n = 5 (green), n = 10 (blue), n = 20 (orange), and n = 30 (purple), respectively. The shadow regions represent the 95% confidence level, the smooth lines are the best fits. Panel (e) shows the best-fit values of q in the q-Gaussian distributions as a function of n for the precursors (the open symbols) and the main bursts (the filled symbols).
Other Images in This Article
Copyright and Terms & Conditions
© 2023. The Author(s). Published by the American Astronomical Society.