Image Details
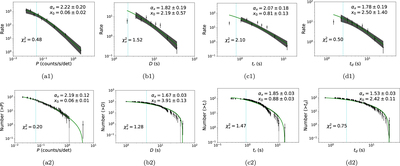
Caption: Figure 1.
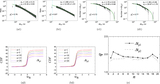
The size distributions of precursors (upper panel: differential distributions, lower panel: cumulative distributions). Panels (a)–(d) display the size distributions of peak fluxes (P), durations (D), rise times (t r ), and decay times (t d ), respectively. The green solid line is the best fit and the gray region represents the 95% confidence level, and the dotted line is marked as the threshold x 0.
Other Images in This Article
Copyright and Terms & Conditions
© 2023. The Author(s). Published by the American Astronomical Society.
Copyright ©
2025 Astronomy Image Explorer. All Rights Reserved.