Image Details
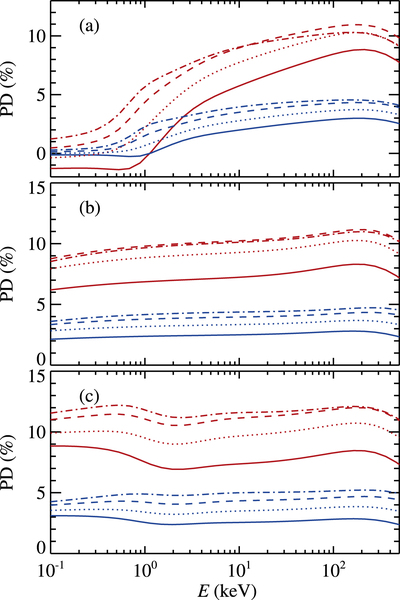
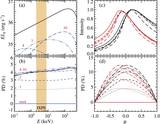
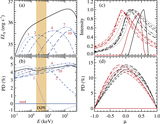
Caption: Figure 3.
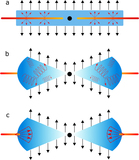
Energy dependence of the PD for the three models shown in Figure 2. The blue and red lines correspond to the inclinations of 30° and 60°, respectively. Solid, dotted, dashed, and dotted–dashed lines correspond to the outflow velocities of β 0 = 0, 0.2, 0.4, and 0.6, respectively. In the middle panel, the red curves for β 0 = 0.4 and 0.6 coincide.
Other Images in This Article
Copyright and Terms & Conditions
© 2023. The Author(s). Published by the American Astronomical Society.
Copyright ©
2025 Astronomy Image Explorer. All Rights Reserved.