Image Details
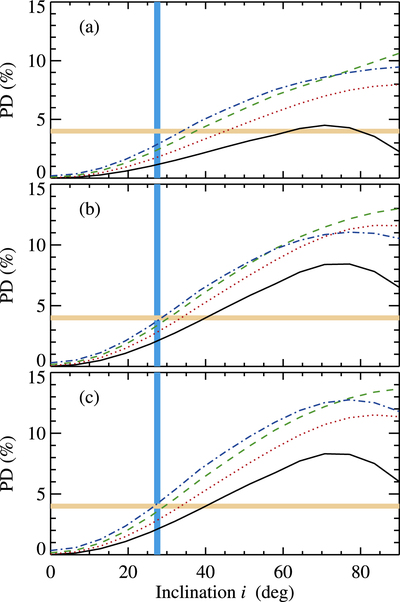
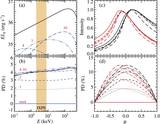
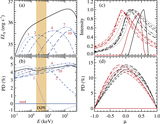
Caption: Figure 2.
Angular distribution of the PD for different outflow velocities β 0 = 0 (black solid), 0.2 (red dotted), 0.4 (green dashed), and 0.6 (blue dotted–dashed) in the middle of the IXPE range at 4 keV for the three models are shown in Figure 1. Coronal parameters are kT e = 100 keV, kT bb = 0.1 keV, and Γ = 1.6. The vertical blue stripe marks the ﹩i={{27.5}_{-0.6}^{+0.8}}^{\circ }﹩ inclination (Miller-Jones et al. 2021) and the horizontal beige stripe corresponds to the observed X-ray PD from Cyg X-1 of 4.0% ± 0.2% (Krawczynski et al. 2022).
Other Images in This Article
Copyright and Terms & Conditions
© 2023. The Author(s). Published by the American Astronomical Society.
Copyright ©
2025 Astronomy Image Explorer. All Rights Reserved.