Image Details
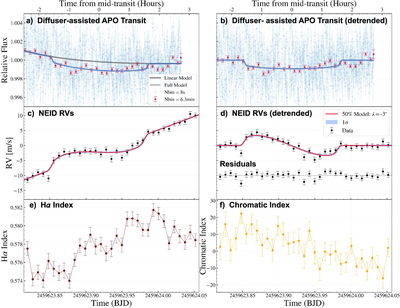
Caption: Figure 2.
(a) Diffuser-assisted photometry from APO with the transit model from the joint APO and TESS fit overlaid in blue. The linear model of the airmass is shown in gray. (b) Diffuser-assisted photometry and the joint transit model detrended from the linear model of the airmass. (c) NEID RV data during the transit of TOI-2076 b revealing a clear detection of the RM effect. We attribute the positive slope to stellar activity. (d) NEID RV data detrended from the overall upward slope and the corresponding residuals. (e) Hα index from NEID RV observations. (f) CRX from the NEID RV observations. The data are available as data-behind the figure.
(The data used to create this figure are available.)
Other Images in This Article
Copyright and Terms & Conditions
© 2023. The Author(s). Published by the American Astronomical Society.