Image Details
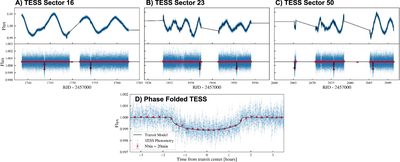
Caption: Figure 1.
TESS lightcurves of TOI-2076 from (A) Sector 16, (B) Sector 23, and (C) Sector 50. The top row shows the TESS photometry (blue points) with along with a transit model for TOI-2076 b + GP model (red) to account for stellar activity. The middle panel shows the photometry after subtracting the quasi-periodic GP model, revealing the TOI-2076 b transits. Panel (D) shows the phase-folded TESS photometry phased to the orbital period of TOI-2076 b, with the transit model overlaid.
Other Images in This Article
Copyright and Terms & Conditions
© 2023. The Author(s). Published by the American Astronomical Society.
Copyright ©
2025 Astronomy Image Explorer. All Rights Reserved.