

Image Details
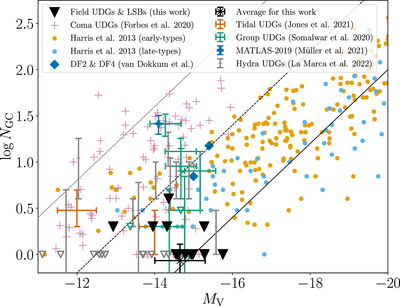
Caption: Figure 3.
Globular cluster counts as a function of V-band absolute magnitude. Dwarf galaxies from Harris et al. (2013) are shown for comparison as light orange (early types) and light blue (late types) circles. The GC counts (Forbes et al. 2020) of the Coma UDGs from van Dokkum et al. (2015) and Yagi et al. (2016) are shown with pink crosses (error bars are omitted to aid the clarity of the plot, but are typically less than 0.35 dex for N GC). The GC counts from this work are shown as black triangles. Those that are above zero are corrected for the missing half of the GCLF. Due to the potential for contamination from other star clusters we consider these values are upper limits on the true values of N GC, and thus those with no GCCs are plotted at N GC = 1. There are nine objects with no GCCs, however several markers overlap (almost) entirely. The mean (corrected) number of GCs per galaxy is shown by the single set of black error bars. UDGs in the Hydra cluster (Iodice et al. 2020; La Marca et al. 2022) are shown with gray error bars and upper limits (unfilled gray triangles). A small sample of UDGs in groups are also shown with green (Somalwar et al. 2020) and dark orange (Jones et al. 2021) error bars. Finally, the UDGs DF2 and DF4 (van Dokkum et al. 2018, 2019) are shown with dark blue diamonds, and MATLAS-2019 (Muller et al. 2021) is shown as a dark blue filled plus sign with an error bar on N GC. The diagonal solid, dashed, and dotted lines correspond to GC specific frequency (Harris & van den Bergh 1981) values of 1, 10, and 100, respectively. It should be noted that the UDGs and LSB galaxies in our sample are considerably bluer than the other UDGs plotted for comparison. If plotted in terms of stellar mass, rather than M V, then they would shift to the left in relative to other UDGs.
Other Images in This Article
Copyright and Terms & Conditions
© 2022. The Author(s). Published by the American Astronomical Society.

