

Image Details
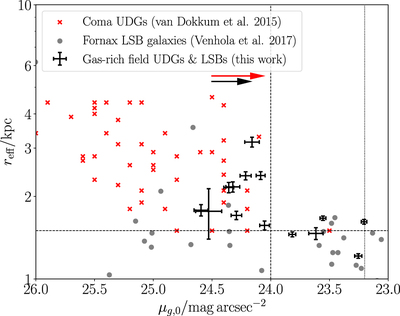
Caption: Figure 1.
Effective radius vs. central surface brightness for our target sample (black error bars) compared to the van Dokkum et al. (2015) UDGs in Coma (red crosses) and LSB galaxies in Fornax (gray circles, Venhola et al. 2017). The horizontal dashed line indicates the standard r eff = 1.5 kpc cutoff for UDGs. The vertical dashed line at μ g,0 = 24 corresponds to the UDG surface brightness criterion of van Dokkum et al. (2015), while the more relaxed limit of van der Burg et al. (2016) is approximated by the dotted line at μ g,0 = 23.2 (for a typical color of g − r = 0.3). Nine of our targets meet the more stringent criteria, while 11 meet the more relaxed criteria. The horizontal red and black arrows indicate how the surface brightness values of the van Dokkum et al. (2015) UDGs and our sample would shift (on average, based on their mean g − r colors) if the r-band central surface brightness was used instead of the g band. As our objects are bluer their surface brightness does not increase as much between the g and r bands.
Other Images in This Article
Copyright and Terms & Conditions
© 2022. The Author(s). Published by the American Astronomical Society.

