Image Details
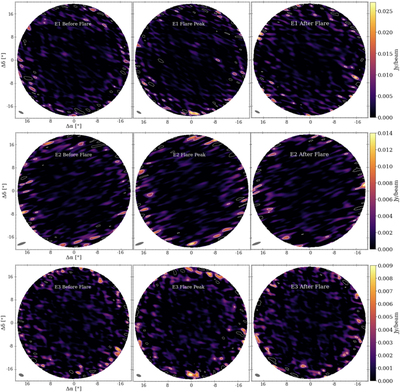
Caption: Figure 3.
Images for all three detected flares (E1, top row; E2, middle row; E3, bottom row) in the integration just before the flare (left panels), at the peak of the flares (middle panels), and just after the flare (right panels). A point source is only detected at the stellar position (bottom center of the image toward the edge of the primary beam) at the flare peak for all three events. The flux density from these images (indicated by the color scale bars) is consistent with what we obtain from visibility modeling.
Other Images in This Article
Copyright and Terms & Conditions
© 2022. The Author(s). Published by the American Astronomical Society.
Copyright ©
2025 Astronomy Image Explorer. All Rights Reserved.