Image Details
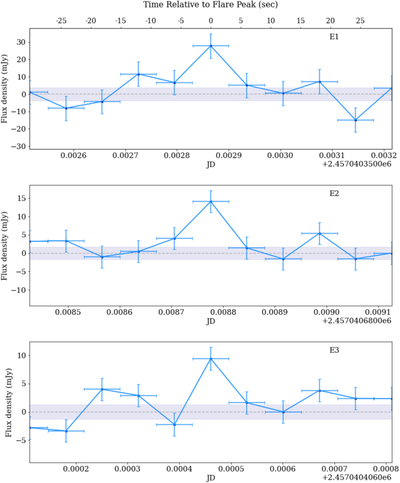
Caption: Figure 2.
Light curves of the three major flaring events labeled E1, E2, and E3. Each light curve is centered on the flare peak, with the top x-axis indicating time relative to the flare peak in seconds. Each data point represents an individual ALMA integration (6 s in length, indicated by the x error bars). The shaded region in each plot indicates ± the rms noise level centered on a dashed line at 0 mJy.
Other Images in This Article
Copyright and Terms & Conditions
© 2022. The Author(s). Published by the American Astronomical Society.
Copyright ©
2025 Astronomy Image Explorer. All Rights Reserved.