Image Details
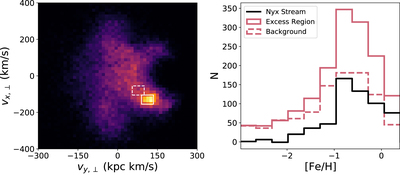
Caption: Figure 5.
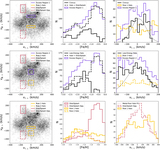
Properties of the Nyx Stream. The left panel shows a heat map of velocities in our polar sample. A solid white outline marks the velocity extent of the excess that has been associated with the Nyx Stream. A dashed white outline marks an adjacent background region of similar size. The right panel shows the MDF for the excess region, the background region, and their difference, which represents the distribution of the Nyx Stream stars.
Other Images in This Article
Copyright and Terms & Conditions
© 2022. The Author(s). Published by the American Astronomical Society.
Copyright ©
2025 Astronomy Image Explorer. All Rights Reserved.