Image Details
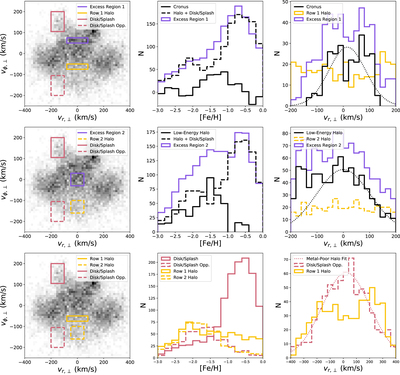
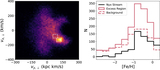
Caption: Figure 4.
Metallicity and radial velocity of the low-energy structures. The top, middle, and bottom rows present results for the low-energy RME (a.k.a. Cronus), the low-energy halo, and the metal-poor halo, respectively. Purple boxes show two samples in regions where an excess has been identified, yellow boxes the halo, and red boxes the disk (solid line) and a region with opposite velocity (dashed line). The middle panels in the top and middle rows show the MDFs of the overdense region (purple line), the estimated total background (dashed black line), and the difference between them (solid black line, corresponding to Cronus and the low-energy halo). The bottom middle panel shows the MDF of the halo and disk comparison regions. The rightmost column shows the v r,⊥ distributions for each substructure, using only stars with −1.5 < [Fe/H] < −1. The top-right panel shows the radial velocity distributions for stars with the v ϕ range of the Cronus excess region (purple line) and the halo region with an opposite v ϕ,⊥ (yellow line). The yellow distribution is artificially high at large ∣v r,⊥∣ due to the VRM velocity lobes. The solid black line shows the difference between the purple and yellow distributions, which represents the Cronus v r,⊥ distribution. A dashed black line shows a Gaussian that has been normalized to the solid black distribution; the depletion near v r,⊥ = 0 in the solid black distribution compared to the Gaussian suggests that Cronus is associated with an RME. The right panel in the center row shows the velocity distribution of the low-energy halo; the Gaussian is not fit on the left side due to the apparent pollution of the data by VRM stars. The bottom-right panel shows the radial velocity distribution of halo stars within the v ϕ range of the dashed red box and a Gaussian fit to it. Also shown is the v r,⊥ distribution for stars with the v ϕ range of the solid yellow box, which includes halo in the center plus VRM lobes on each side.
Other Images in This Article
Copyright and Terms & Conditions
© 2022. The Author(s). Published by the American Astronomical Society.