Image Details
Caption: Figure 1.
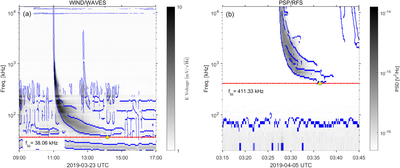
Two examples of edge recognition using the Canny method for type III bursts. The radio dynamic spectra of WIND/WAVES and PSP/RFS are shown in panels (a) and (b), respectively. The blue dots or lines are the edges of type III bursts and other noises obtained by the Canny method. In each panel, the lowest point in the edge of a clear type III burst is marked by a yellow point, and the corresponding cutoff frequency f lo is labeled by the red dashed line.
Other Images in This Article
Copyright and Terms & Conditions
© 2022. The Author(s). Published by the American Astronomical Society.
Copyright ©
2026 Astronomy Image Explorer. All Rights Reserved.