Image Details
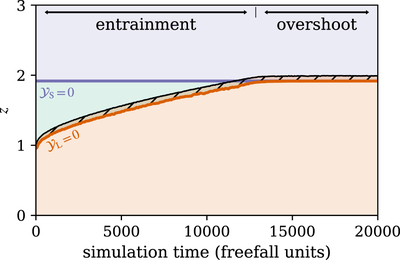
Caption: Figure 3.
A Kippenhahn-like diagram of the simulation evolution. The y-axis is the simulation height, and the x-axis is the simulation time. The orange line denotes the Ledoux convective boundary (﹩{{ \mathcal Y }}_{{\rm{L}}}=0﹩); the CZ is below this and is colored orange. The purple line denotes the Schwarzschild convective boundary (﹩{{ \mathcal Y }}_{{\rm{S}}}=0﹩); the RZ is above this and is colored purple. The SZ between these boundaries is colored green. The black line denotes the top of the overshoot zone, which is hashed. The simulation has an “entrainment phase”, in which the CZ expands, and a pure “overshoot phase,” in which the convective boundary remains stationary.
Other Images in This Article
Copyright and Terms & Conditions
© 2022. The Author(s). Published by the American Astronomical Society.