Image Details
Caption: Figure 1.
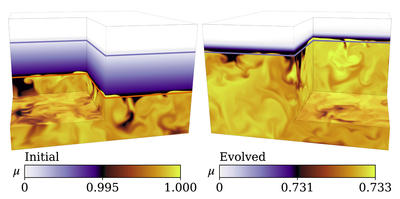
Volume renderings of the composition μ at early (left) and late (right) times. A stable composition gradient is denoted by the changing color from the top of the box (white) to the top of the convection zone (dark purple). The convection zone is well mixed, so we expand the color-bar scaling there; black low-μ fluid is mixed into the yellow high-μ convection zone. Orange and purple horizontal lines respectively denote the heights at which ﹩{{ \mathcal Y }}_{{\rm{L}}}=0﹩ and ﹩{{ \mathcal Y }}_{{\rm{S}}}=0﹩. The Schwarzschild and Ledoux criteria are equivalent in the right panel, so the orange line is not visible. The simulation domain spans z ∈ [0, 3], but we only plot z ∈ [0, 2.5] here. An animation of this figure is available online in the published article. A version is also in the supplementary materials (Anders et al. 2022b). In the animation, the initial Ledoux boundary height is denoted as a dotted orange line. The animation starts at t = 130 freefall time units and ends at t = 15,520. There are two important timescales in this problem: the short convective overturn timescale and the long entrainment timescale of the composition gradient. At early times, the movie playback speed is slow, and the evolution of convective structures can be observed over time. To show the much longer entrainment timescale, the animation speed increases by a factor of 25 for t ∈ [400, 15,000], during which time the convective boundary advances. After t = 15,000, the movie returns to its original, slow playback speed and focuses again on the convective structures. The total, real-time duration of the animation is 45 s.
(An animation of this figure is available in the HTML version of this article.)
The video/animation of this figure is available in the online journal.
Other Images in This Article

Copyright and Terms & Conditions
© 2022. The Author(s). Published by the American Astronomical Society.