Image Details
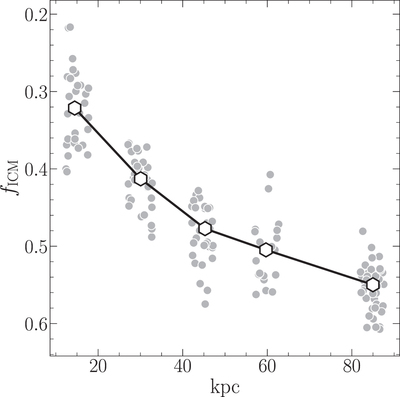
Caption: Figure 4.
The distribution of f ICM in clumps identified in a snapshot of the tail of a simulated RPS galaxy (440 Myr in HDLV from Tonnesen & Bryan 2021) as a function of the distance from the galaxy. Gray dots refer to the values of clumps, while white hexagons indicate the median value at each given distance.
Other Images in This Article
Copyright and Terms & Conditions
© 2021. The Author(s). Published by the American Astronomical Society.
Copyright ©
2025 Astronomy Image Explorer. All Rights Reserved.