Image Details
Caption: Figure 1.
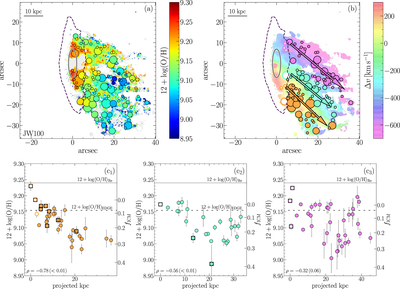
JW100. Panel (a): gas-phase metallicity map. The circles identify the position and the size of the star-forming clumps. Underlying gray spaxels correspond to the distribution of the Hα emission with a signal-to-noise ratio greater than 5. Panel (b): color-coded gas velocity field map with superimposed clumps belonging to different subtails. Each subtail is identified by a different color (not correlated to the color bar). Open dots correspond to clumps inside the galaxy body. The arrows indicate the direction of the stripping for each subtail. In panels (a) and (b), the dashed contour shows the galaxy body and the gray ellipse indicates the effective radius. Panels (c1)–(c3): projected metallicity profile of each subtail. Dots and error bars refer to clump metallicities and associated uncertainties, respectively. Square frames indicate star-forming clumps according to [O I]-BPT. Colors correspond to panel (b). Gray horizontal lines and the faded areas denote the metallicity at the effective radius and the corresponding uncertainty. Dashed lines indicate the expected metallicity at the edge of the stellar body. In the bottom left corner we also report the Pearson correlation coefficient (and the corresponding p-value) of the observed trends. The scale on the right y-axis indicates the fraction of ICM as explained in the text.
Other Images in This Article
Copyright and Terms & Conditions
© 2021. The Author(s). Published by the American Astronomical Society.