Image Details
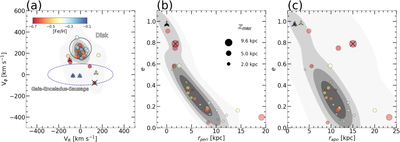
Caption: Figure 4.
Kinematics and orbital-element properties of selected GCD stars. The color-coding of the symbols in the panels is based on their [Fe/H], while the gray background shading represents the kernel density estimation (KDE) model of the overlaid points. The distribution of the velocity component VR vs. Vϕ is shown in panel (a). The blue dashed line represents the approximate region for sources associated with the Gaia–Enceladus–Sausage in VR vs. Vϕ, based on Belokurov et al. (2018). The area occupied by disk-like stars is also highlighted with the black empty circle. The perigalactic and apogalactic distances, as a function of the orbital eccentricity, are shown in panels (b) and (c), respectively. The point sizes reflect their maximum vertical heights above the Galactic plane (﹩{{\rm{Z}}}_{{\text{}}{\max }}﹩), with decreasing size for decreasing ﹩{{\rm{Z}}}_{{\text{}}{\max }}﹩. Three black points at 2, 5, and 9.6 kpc are provided as a visual aid. Black up-tick symbols mark the stars with P–R orbital configurations (see text), while the “X” symbol indicates the star with a retrograde orbit.
Other Images in This Article
Copyright and Terms & Conditions
© 2021. The American Astronomical Society. All rights reserved.