Image Details
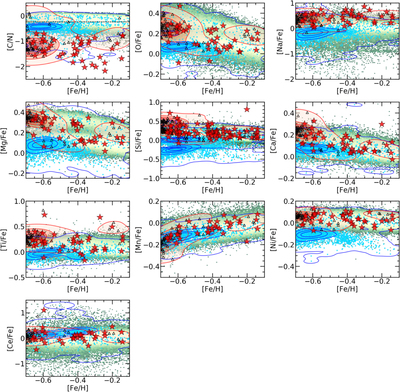
Caption: Figure 3.
Chemical-abundance patterns of selected elements for the relatively high-metallicity GCD population (red filled stars) compared to the MW stars (green 2D density histogram), dwarf galaxy populations (cyan circles and blue contours), and GC populations (black empty triangles and red contours). The black dotted line highlighted in the [Fe/H]–[C/N] plane indicates the limit above which extra-mixing episodes are expected to take place (see, e.g., Shetrone et al. 2019).
Other Images in This Article
Copyright and Terms & Conditions
© 2021. The American Astronomical Society. All rights reserved.
Copyright ©
2026 Astronomy Image Explorer. All Rights Reserved.