

Image Details
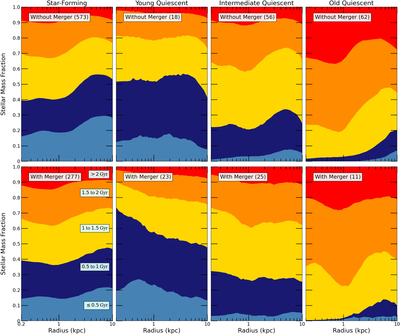
Caption: Figure 5.
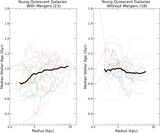
Stacked normalized histograms showing the radial distribution of stellar ages in each galaxy population. All stellar particles of all galaxies in a given population are split into five age bins; the colored bands show the fractional contribution of each bin to the total stellar mass, as a function of radius. Galaxies are divided according to whether they experienced (bottom row) or did not experience (top row) a significant merger prior to z = 2. The number of galaxies in each category are indicated in brackets. The data and software to generate this Figure are available on Zenodo: 10.5281/zenodo.5093727 (GitHub: https://github.com/pathakde/Pathak_2021).
Other Images in This Article
Copyright and Terms & Conditions
© 2021. The American Astronomical Society. All rights reserved.

