

Image Details
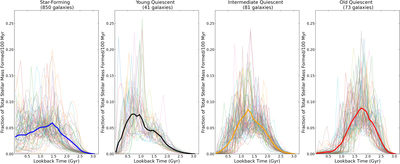
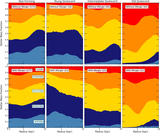
Caption: Figure 1.
Star formation histories for the four galaxy populations. For the star-forming population we only show 80 randomly drawn galaxies, for clarity. The curves are binned over 100 Myr and normalized by the total mass formed by z = 2. In each panel, a thick line marks the median trend. The data and software to generate this Figure are available on Zenodo:10.5281/zenodo.5093727 (GitHub: https://github.com/pathakde/Pathak_2021).
Other Images in This Article
Copyright and Terms & Conditions
© 2021. The American Astronomical Society. All rights reserved.

Copyright ©
2026 Astronomy Image Explorer. All Rights Reserved.
