Image Details
Caption: Figure 4.
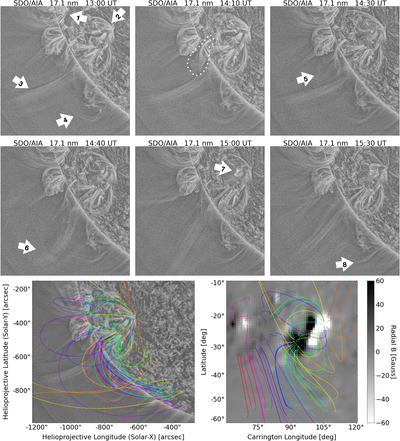
MGN processed images from the 17.1 nm (Fe IX) bandpass of SDO/AIA (see Section 3.2). The field of view is identical to that of Figure 3. The bottom panels show traced magnetic field lines from a PFSS model overlaid on the MGN processed 14:00 UT 17.1 nm AIA image (left) and on the ADAPT synoptic magnetic field map (right). Each individual field line trace has a unique color, which is used in both panels. An associated animation of the the AIA data 17.1 nm from 12:00 UT to 16:58 UT on the day of the eclipse is available. The realtime duration of the video is 15 s.
(An animation of this figure is available.)
The video/animation of this figure is available in the online journal.
Other Images in This Article
Copyright and Terms & Conditions
© 2021. The American Astronomical Society. All rights reserved.