Image Details
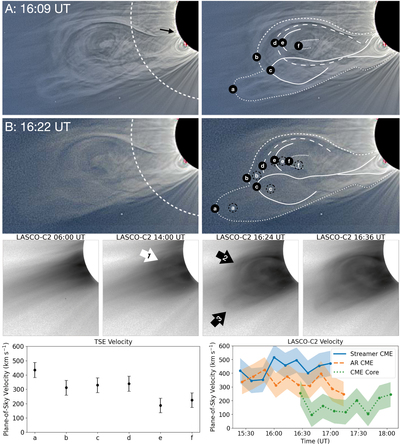
Caption: Figure 2.
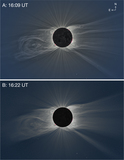
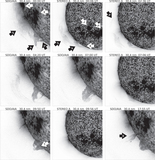
The top two rows correspond to the TSE images from Néuquen (A) and Río Negro (B), respectively. The left panels are cropped versions of the images from Figure 1, with the dashed arc showing approximately the inner most extent of LASCO-C2 observations (2.2 R⊙). The right panels are the same except with hand-drawn lines indicating the approximate magnetic structure of various features of the CME. Several distinct structures are labeled with black circles in both panels. The initial position of the points at site A are plotted as dashed circles for the site B trace to show their motion between eclipse sites. The middle four panels are color-inverted and cropped images from the LASCO-C2 space-based coronagraph on board SOHO. These images have been processed to flatten the radial gradient in brightness to show changing structures in the corona (see Section 3.1 for processing procedure). The inferred plane-of-sky velocities from the labeled structures in the eclipse panels are shown in the bottom left panel. The velocities inferred for the three main features seen in the LASCO-C2 images are shown in the bottom right panel. An animation showing the full field of view of the LASCO-C2 data from 06:00 to 14:54 UT on the day of the eclipse is available online, corresponding to a realtime duration of the video that is 19 s.
(An animation of this figure is available.)
The video/animation of this figure is available in the online journal.
Other Images in This Article

Copyright and Terms & Conditions
© 2021. The American Astronomical Society. All rights reserved.