Image Details
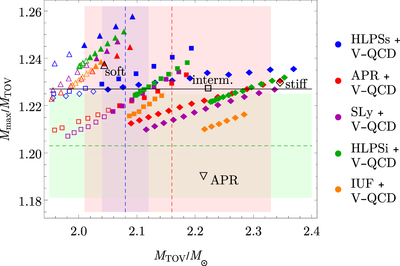
Caption: Figure 5.
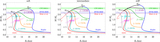
Mass ratio Mmax/MTOV vs. MTOV for an ensemble of hybrid EoSs from Jokela et al. (2020). The colored markers show the results for different low-density nuclear matter models, indicated in the legend, as the matching density ntr varies. Triangles, squares, and diamonds use soft, intermediate, and stiff versions of the holographic model, respectively. The filled (open) markers are EoSs for which the Keplerian curve reaches (fails to reach) the GW190814 band in Figure 4. The EoSs used in the other figures are shown with large black open markers. The green, blue, and red bands show the estimates for the mass ratio (Breu & Rezzolla 2016), minimum of MTOV based on GW190814 (Most et al. 2020), and maximum of MTOV (Rezzolla et al. 2018), respectively. The horizontal black line shows our fit result from (3).
Other Images in This Article
Copyright and Terms & Conditions
© 2021. The American Astronomical Society. All rights reserved.