Image Details
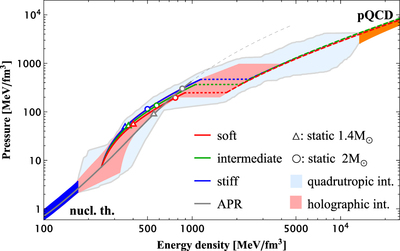
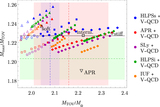
Caption: Figure 1.
EoSs. Red, green, and blue curves are the V-QCD EoSs where first-order phase transitions are indicated by dotted lines and the quark phases by dashed lines. Gray curve is the APR EoS whose superluminal part is the dashed part of the curve. Centers of static 1.4 M⊙ and 2 M⊙ stars are marked by triangles and circles, respectively. Blue and orange bands indicate uncertainty in nuclear theory and perturbative QCD, respectively. The light red (light blue) band is spanned by holographic (general quadrutropic) interpolations between the low- and high-density limits.
Other Images in This Article
Copyright and Terms & Conditions
© 2021. The American Astronomical Society. All rights reserved.
Copyright ©
2025 Astronomy Image Explorer. All Rights Reserved.