Image Details
Caption: Figure 5.
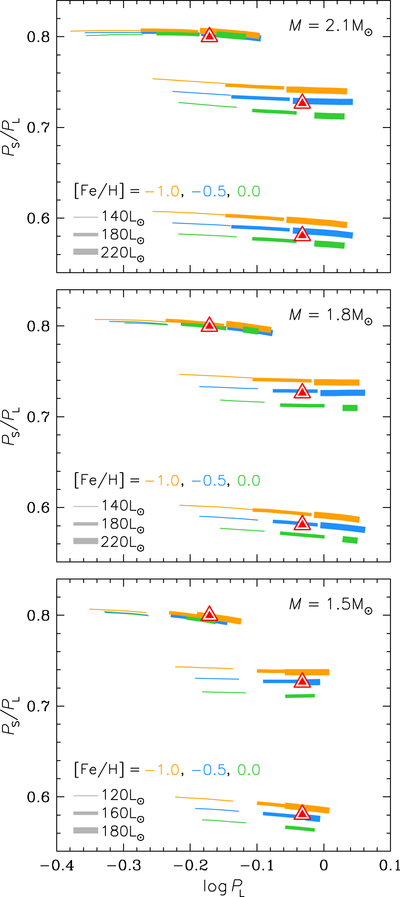
Petersen diagrams with linear pulsation models for OGLE-GAL-ACEP-091 (red triangles). The top, middle, and bottom panels correspond to models of M = 2.1, 1.8, and 1.5 ﹩{M}_{\odot }﹩, respectively. In each panel, line segments correspond to horizontal model sequences of constant L (value indicated with line thickness) and effective temperature varying in 100 K steps, in which F, 1O, and 2O are simultaneously unstable. Models for three different metallicities are plotted with different colors.
Other Images in This Article

Copyright and Terms & Conditions
© 2020. The American Astronomical Society. All rights reserved.
Copyright ©
2025 Astronomy Image Explorer. All Rights Reserved.