Image Details
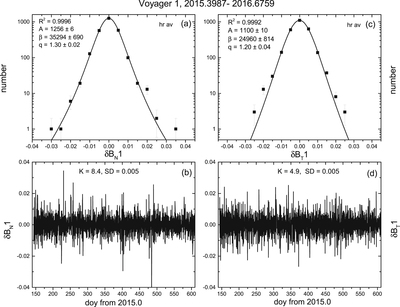
Caption: Figure 2.
Observations of intermittency using hourly average data by Voyager 1 from 2013.3593 to 2014.6373. Panel (b) shows the time series of 1 hr increments in the B N component of the magnetic field, labeled δB N1, as a function of time. (a) The points derived from a histogram of the success of 1 hr increments in the component B N of the magnetic field ﹩{\boldsymbol{B}}﹩ (δB N1). The solid curve is a fit of a q-Gaussian distribution to the observations. The value of q, a measure of the intermittency of the fluctuations, is shown in the upper right corner of the panel together with the amplitude A and the parameter β that is inversely related to the width of the distribution. R 2 is the coefficient of determination of the fit. The panels on the right, (c) and (d), correspond to the panels on the left except that they refer to the 1 hr increments in the B T component of the magnetic field, δB T1.
Other Images in This Article
Copyright and Terms & Conditions
© 2020. The American Astronomical Society. All rights reserved.