Image Details
Caption: Figure 4.
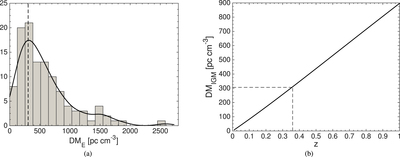
(a) DME distribution for the entire FRB sample. The thick solid line shows the kernel density estimate of the distribution. The peak of the distribution at ﹩{\mathrm{DM}}_{{Ep}}=306.3﹩ pc cm−3 is indicated by the vertical dashed line. (b) DMIGM–z relation (solid line). The dashed line marks ﹩z\approx 0.36﹩ corresponding to DMEp.
Other Images in This Article
Copyright and Terms & Conditions
© 2020. The Author(s). Published by the American Astronomical Society.
Copyright ©
2026 Astronomy Image Explorer. All Rights Reserved.