Image Details
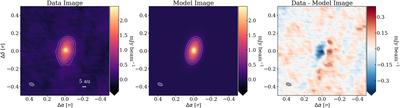
Caption: Figure 3.
Our data image, model image, and residuals. For the data and model image, contour levels are in steps of [5, 10, 20, 30] × σ (where σ = 56 μJy beam−1, the rms of the image). For our residuals we plot contour levels [−7, −5, −4, −3, 3, 5] × σ (σ = 52 μJy beam−1). Negative values are dashed contours and positive values are solid.
Other Images in This Article
Copyright and Terms & Conditions
© 2020. The American Astronomical Society. All rights reserved.
Copyright ©
2025 Astronomy Image Explorer. All Rights Reserved.