Image Details
Caption: Figure 2.
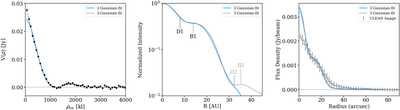
(left) Visibility profile for continuum emission of GQ Lup. Black dots show the real parts of visibilities. In each panel, the blue curve is our best-fitting model, while the gray curve shows a 3-Gaussian-fit that best fits the data at the shortest baselines but lacks motivation from peaks in the visibility profile. (center) Our model radial intensity profile for GQ Lup A. Dashed lines denote gaps, and solid lines denote rings. (right) Azimuthally averaged radial profile of the observed flux density (CLEAN image) compared with the model prediction from visibility fitting in blue. The visibility-fitting method generally matches the CLEANed method but also reveals smaller-scale structures.
Other Images in This Article
Copyright and Terms & Conditions
© 2020. The American Astronomical Society. All rights reserved.