Image Details
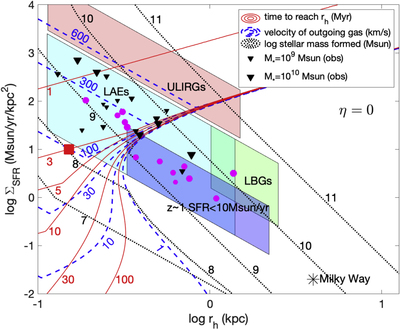
Caption: Figure 2.
The time that it takes to evacuate the gas to an altitude of ﹩{r}_{h},{t}_{h}-{t}_{L}﹩, as the solid red contours labeled in units of Myr, with labels “1,” “3,” “5,” “10,” “30,” and “100.” Shown as dotted black contours are the log of the stellar mass in units of ﹩\,{M}_{\odot }﹩ formed from this episode, with labels “8,” “9,” “10,” and “11.” The dashed blue contours depict the radial velocity of gas being lifted in units of ﹩\,\mathrm{km}\,{{\rm{s}}}^{-1}﹩, with labels “10,” “30,” “100,” “300,” and “600.” The shaded light blue, light green, light red, and dark blue regions indicate approximately regions normally referred to Lyα emitters (LAEs), Lyman-break galaxies (LBGs) at high redshift, ultra-luminous infrared galaxies (ULIRGs), and z ∼ 1 star-forming but non-LyC leaking dwarf galaxies, respectively. The LAE region is obtained by using a radius range of 0.1–1.4 kpc and a range of SFR of 1–100 ﹩\,{M}_{\odot }﹩ yr−1 (e.g., Gawiser et al. 2007; Bond et al. 2009). The LBG region is obtained by using a radius range of 1.2–2.5 kpc and a range of SFR of 5–100 ﹩\,{M}_{\odot }﹩ yr−1 (Giavalisco 2002). The ULIRG region is approximately delineated by a radius range of 0.1–1.5 kpc and a range of SFR of 120–1200 ﹩\,{M}_{\odot }﹩ yr−1 (e.g., Spence et al. 2018). The location of the Milky Way galaxy is indicated by a black star near the lower-right corner. The sample of star-forming but non-LyC leaking dwarf galaxies at z ∼ 1 with SFR < 10 ﹩\,{M}_{\odot }﹩ yr−1 (Rutkowski et al. 2016) is the blue shaded region labeled as “z ∼ 1 SFR < 10 ﹩\,{M}_{\odot }﹩ yr−1.” Finally, the observed galaxies with large LyC escape fractions are shown as black downward-pointing triangles from various sources (e.g., Alexandroff et al. 2015; Izotov et al. 2016a, 2016b, 2018a, 2018b; Wang et al. 2019), where some galaxies known as LAEs but with little LyC escape are shown as solid magenta dots (Alexandroff et al. 2015). In all cases for M*, rh and SFR of observed LyC leakers and non-leakers we use updated values from Wang et al. (2019).
Other Images in This Article
Copyright and Terms & Conditions
© 2020. The American Astronomical Society. All rights reserved.