Image Details
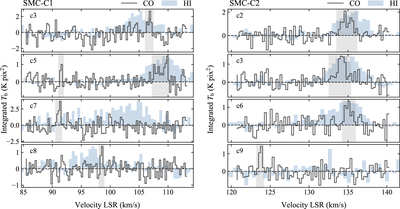
Caption: Figure 3.
Spectra of the main clumps of 12CO(2 → 1) emission (black line) detected with APEX for SMC-C1 (left panels) and SMC-C2 (right panels). Spectra are integrated over a 0.′7 circular aperture. The velocity range of each detection is highlighted in gray. The narrow emission line at ﹩{V}_{\mathrm{LSR}}\simeq 91\,\mathrm{km}\,{{\rm{s}}}^{-1}﹩ visible in the SMC-C1’s clump 5 spectrum is contaminated from the nearby, spectrally decoupled, clump 4. Light blue histograms denote H I spectra integrated on the same aperture and normalized to the CO peak for a easier visualization.
Other Images in This Article
Copyright and Terms & Conditions
© 2019. The American Astronomical Society. All rights reserved.
Copyright ©
2025 Astronomy Image Explorer. All Rights Reserved.