Image Details
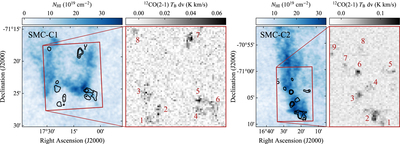
Caption: Figure 2.
H I and CO maps of SMC-C1 (left panels) and SMC-C2 (right panels). Column-density maps of the H I emission from ASKAP observations (McClure-Griffiths et al. 2018), integrated over the velocity range ﹩90\mbox{--}115\,\mathrm{km}\,{{\rm{s}}}^{-1}﹩ (SMC-C1) and ﹩120\mbox{--}140\,\mathrm{km}\,{{\rm{s}}}^{-1}﹩ (SMC-C2), are shown in blue color scale. The fields mapped in the 12CO(2 → 1) emission line with APEX are delimited with red boxes. Gray scale maps represent the integrated intensity of the 12CO(2 → 1) emission line. We identify eight clumps of molecular gas in the SMC-C1 field and nine in SMC-C2, labeled in red in the CO maps. On the H I maps, we overlay the CO contours at levels of [0.02, 0.04] K km s−1.
Other Images in This Article
Copyright and Terms & Conditions
© 2019. The American Astronomical Society. All rights reserved.