Image Details
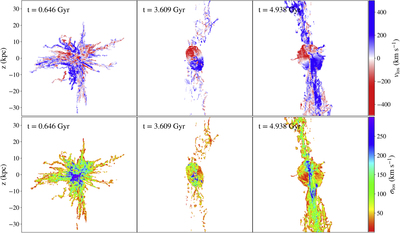
Caption: Figure 3.
Line-of-sight velocity (top) and velocity dispersion (bottom) maps calculated for the Hα filaments that are predominantly radial (t = 0.65 Gyr) or collimated along the jet axis (t = 3.61 and 4.94 Gyr) in simulation RT02.
Other Images in This Article

Copyright and Terms & Conditions
© 2019. The American Astronomical Society. All rights reserved.
Copyright ©
2026 Astronomy Image Explorer. All Rights Reserved.