Image Details
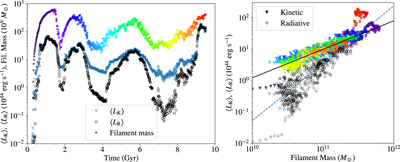
Caption: Figure 2.
Left panel: evolution of the average kinetic (blue triangles), radiative luminosity (black circles), and Hα filament mass (multicolor stars) measured in simulation RT02. Right panel: the kinetic (multicolor triangle) and radiative (black circle) luminosity as a function of the filament mass. The color marks the time in the simulation. Correlation of ﹩\langle {L}_{{\rm{K}}}\rangle ﹩ (﹩\langle {L}_{{\rm{R}}}\rangle ﹩) with the Hα filament mass for the first 9 Gyr is represented by the solid black (dashed blue) line.
Other Images in This Article

Copyright and Terms & Conditions
© 2019. The American Astronomical Society. All rights reserved.
Copyright ©
2026 Astronomy Image Explorer. All Rights Reserved.