Image Details
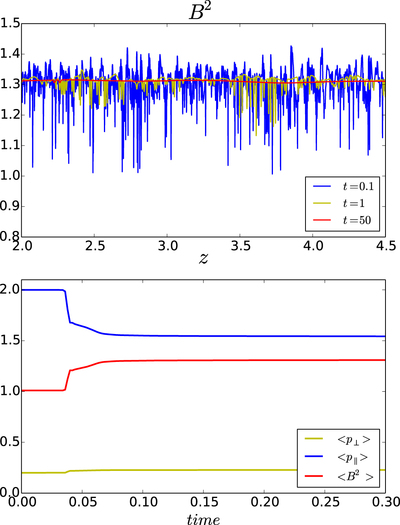
Caption: Figure 2.
Results from the highest-resolution simulation (﹩{\theta }_{0}=0﹩, N = 16384). Upper panel: plot of the total magnetic field magnitude B2(z) in the subdomain z = 2–4.5 at three different times. Lower panel: temporal evolution of the average B2, ﹩{p}_{\parallel }﹩ and ﹩{p}_{\perp }﹩ during the linear stage and saturation.
Other Images in This Article
Copyright and Terms & Conditions
© 2018. The American Astronomical Society. All rights reserved.
Copyright ©
2026 Astronomy Image Explorer. All Rights Reserved.