Image Details
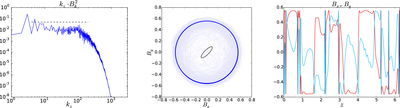
Caption: Figure 3.
Final state from the highest-resolution simulation (θ0 = 0, N = 16384). Left panel: compensated magnetic energy spectrum mediated between t = 40 and t = 50. Middle panel: hodogram of the magnetic field at t = 0 (black), t = 0.1 (light blue) and t = 50 (blue). Right panel: magnetic field components Bx(z) (light blue) and By(z) (red) at t = 50.
Other Images in This Article
Copyright and Terms & Conditions
© 2018. The American Astronomical Society. All rights reserved.
Copyright ©
2024 Astronomy Image Explorer. All Rights Reserved.