Image Details
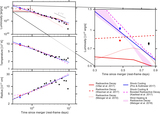
Caption: Figure 1.
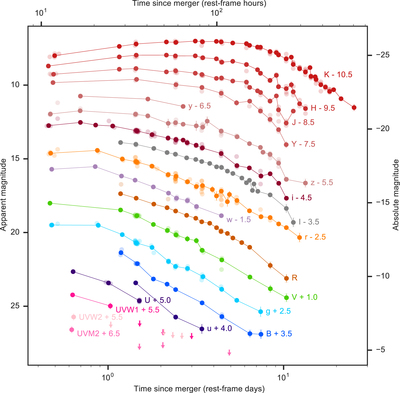
Combined ultraviolet–optical–infrared light curve of the GW170817 kilonova with the original data in semi-transparent circles and the binned data in opaque circles (see the text for references). A rise in the optical bands is apparent on a ∼1 day timescale. 1σ error bars are plotted for the binned data and are sometimes smaller than the markers used.
Other Images in This Article
Copyright and Terms & Conditions
© 2018. The American Astronomical Society. All rights reserved.
Copyright ©
2026 Astronomy Image Explorer. All Rights Reserved.