Image Details
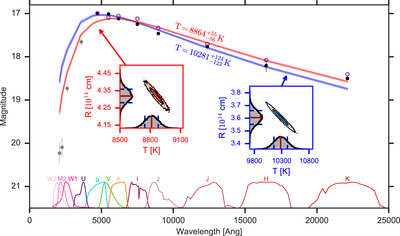
Caption: Figure 2.
Blackbody fits to the optical and infrared SED at discovery (black points; blue fit) and to the ultraviolet, optical, and infrared (the ultraviolet data are from four hours after discovery; gray points; red fit). Including the ultraviolet data reduces the inferred blackbody temperature by ∼1500 K, resulting in a lower bolometric luminosity at discovery (Figure 5). Optical and infrared magnitudes interpolated to the ultraviolet epoch are shown in purple empty circles for comparison and demonstrate the rapid evolution of the SED at these times. The insets show the corner plots for each MCMC fit, with contour lines denoting 50% and 90% bounds, red and blue solid lines (overplotted on each histogram) denoting the mean and median of each parameter distribution (on top of each other in most cases), and dashed lines denoting 68% confidence bounds. The bandpasses of the different filters used are shown at the bottom of the main plot.
Other Images in This Article

Copyright and Terms & Conditions
© 2018. The American Astronomical Society. All rights reserved.