Image Details
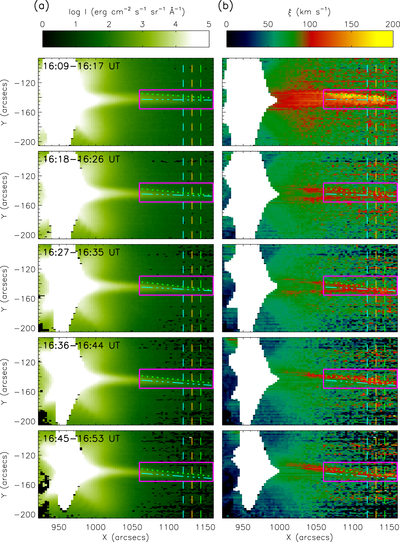
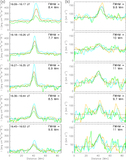
Caption: Figure 3.
Temporal evolution of the Fe XXIV line intensity (a) and nonthermal velocity (b). The magenta box (same as in Figure 2) indicates the current sheet region. The green dotted and cyan dashed–dotted lines mark the locations where the Fe XXIV line intensity and nonthermal velocity are plotted in Figure 4. The three vertical dashed slices are used to measure the thickness of the current sheet, as shown in Figure 5. Note that the white area, especially in panel (b), represents a saturation in the Fe XXIV line profile.
Other Images in This Article
Copyright and Terms & Conditions
© 2018. The American Astronomical Society. All rights reserved.
Copyright ©
2024 Astronomy Image Explorer. All Rights Reserved.