Image Details
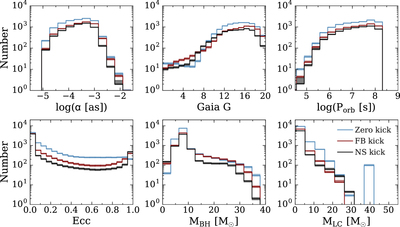
Caption: Figure 4.
Distributions for the number of observable properties of BH-LCs in the MW (thin and thick disks) potentially detectable by Gaia. Histograms represent the mode of each bin height for our 500 population realizations, with shaded regions showing ﹩3\sigma ﹩ confidence limits above and below the mode. Blue, red, and black shading denote Zero-kick, FB-kick, and NS-kick models, respectively.
Other Images in This Article
Copyright and Terms & Conditions
© 2017. The American Astronomical Society. All rights reserved.
Copyright ©
2025 Astronomy Image Explorer. All Rights Reserved.