Image Details
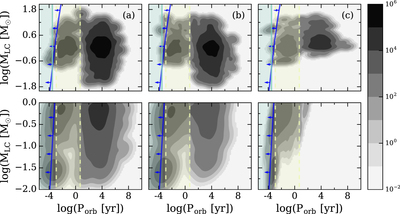
Caption: Figure 2.
Two-dimensional probability dimension functions (PDFs) for all of the BH-LCs in the MW in the LC-mass vs. orbital period plane. The top and bottom rows show distributions for the thin and thick disk, respectively. Columns (a)–(c) show Zero-kick, FB-kick, and NS-kick models, respectively. Light blue bands show the spread of orbital periods observable by LISA. Blue lines represent an approximate upper limit for accreting BHs via Roche-lobe overflow (estimated using ﹩{M}_{\mathrm{BH}}\approx 36\,{M}_{\odot }﹩, the most massive BH created in our models). Yellow bands bounded by dotted lines show the Gaia-observable range, spanning ﹩{P}_{\mathrm{orb}}\simeq 0.5\,\mathrm{day}﹩ to ﹩5\,\mathrm{years}﹩.
Other Images in This Article
Copyright and Terms & Conditions
© 2017. The American Astronomical Society. All rights reserved.