Image Details
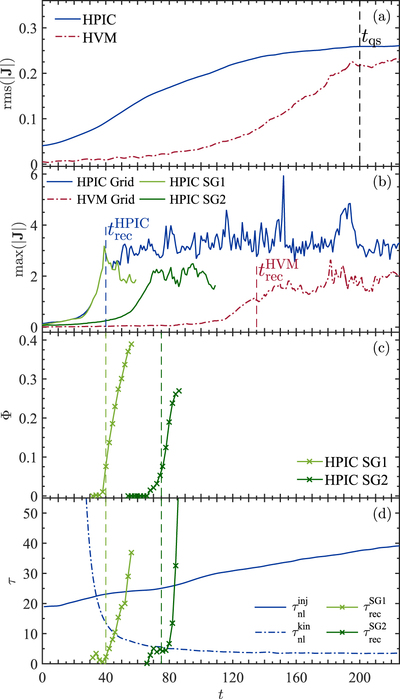
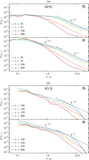
Caption: Figure 1.
Time evolution of a few global and local quantities. Panel (a): ﹩\mathrm{rms}(| {\boldsymbol{J}}| )﹩ in the HPIC (blue) and the HVM (red) runs. The black line marks the quasi-steady state at ﹩{t}_{\mathrm{qs}}\sim 200﹩. Panel (b): ﹩\max (| {\boldsymbol{J}}| )﹩ in the whole HPIC (blue) and HVM (red) grids, and in two HPIC subgrids (cf. Figures 2(c)–(f)). The blue and red vertical lines mark the time when magnetic reconnection start occurring, ﹩{t}_{\mathrm{rec}}^{\mathrm{HPIC}}﹩ and ﹩{t}_{\mathrm{rec}}^{\mathrm{HVM}}﹩, respectively. Panel (c): reconnected flux, Φ, in the two HPIC grids. Panel (d): comparison between the eddy turnover time at the injection scale, ﹩{\tau }_{\mathrm{nl}}^{\mathrm{inj}}﹩, and at kinetic scale, ﹩{\tau }_{\mathrm{nl}}^{\mathrm{kin}}﹩, and the inverse reconnection rate in the two HPIC grids, ﹩{\tau }_{\mathrm{rec}}^{\mathrm{SG}1}﹩ and ﹩{\tau }_{\mathrm{rec}}^{\mathrm{SG}2}﹩.
Other Images in This Article
Copyright and Terms & Conditions
© 2017. The American Astronomical Society. All rights reserved.
Copyright ©
2026 Astronomy Image Explorer. All Rights Reserved.