Image Details
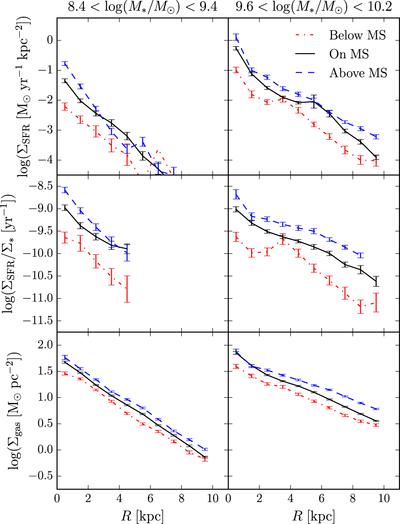
Caption: Figure 3.
Stacked SFR (top row), sSFR (middle row), and neutral gas (bottom row) surface density profiles (binned into 1 kpc annuli) for two stellar mass bins, ﹩8.4\lt \mathrm{log}({M}_{\star }/{M}_{\odot })\lt 9.4﹩ (left column) and ﹩9.6\lt \mathrm{log}({M}_{\star }/{M}_{\odot })\lt 10.2﹩ (right column), for ﹩0.7\lt z\lt 1.5﹩. Prior to stacking, in each mass bin, the galaxies have been separated according to their position relative to the MS: above (blue dashed), on (black solid), or below (red dashed–dotted). The SFR, sSFR, and ﹩{{\rm{\Sigma }}}_{\mathrm{gas}}﹩ profiles generally decrease monotonically with radius. Moreover, the stacked profiles of galaxies above (below) the MS are above (below) those of MS galaxies at nearly all radii.
Other Images in This Article
Copyright and Terms & Conditions
© 2017. The American Astronomical Society. All rights reserved.