Image Details
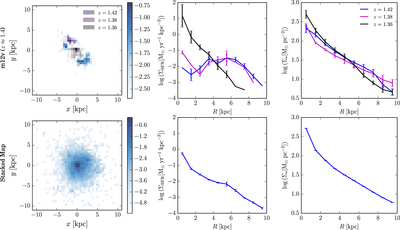
Caption: Figure 1.
Top row: three SFR surface density maps (left column) and radial SFR (middle column) and mass (right column) profiles from different time slices of the “m12v” simulation around ﹩z\approx 1.4﹩. Bottom row: the results of stacking 205 snapshots in total from three different central galaxies with ﹩{M}_{\star }\sim {10}^{10}\,{M}_{\odot }﹩ at redshifts ﹩0.7\lt z\lt 1.5﹩. The individual galaxy’s SFR maps reveal irregular, asymmetric, and highly time-variable SFR spatial distributions, and individual maps are often dominated by off-center star-forming clumps. In two cases, the radial SFR profiles have central peaks, but in one of those cases, the bulk of the star formation corresponds to the local maximum at ﹩R\sim 5\,\mathrm{kpc}﹩. The stacked map exhibits a clear central peak in SFR and has a monotonically radially decreasing SFR profile; it thus does not capture the diversity of SFR maps and profiles of single galaxy snapshots. In contrast, the individual galaxies’ stellar mass profiles are all similar to the stacked stellar mass profile.
Other Images in This Article
Copyright and Terms & Conditions
© 2017. The American Astronomical Society. All rights reserved.