Image Details
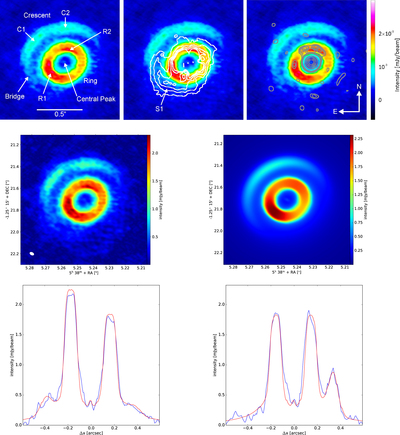
Caption: Figure 1.
Top: ALMA 870 μm image with the spatial components labeled (left) and overplotted with the H-band scattered-light image by Ohta et al. (2016; middle, contours at 1%, 2%, 3%, 4%, and 5% of peak intensity) and the NIRC2 ﹩L^{\prime} ﹩-band aperture masking image by Willson et al. (2017; right, contours at 2%, 3%, 4%, 5%, 20%, 40%, 60%, and 80%). Middle: ALMA image (left) and synthetic image for our best-fit model (convolved with the interferometric beam; right). Bottom: radial intensity cuts along the disk major (left) and minor-axis (right) for the ALMA image (blue line) and the model (red line).
Other Images in This Article
Copyright and Terms & Conditions
© 2017. The American Astronomical Society. All rights reserved.
Copyright ©
2026 Astronomy Image Explorer. All Rights Reserved.