Image Details
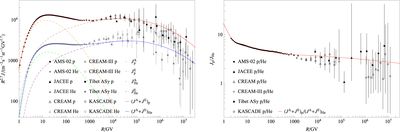
Caption: Figure 1.
Best fit to the proton and helium spectra (left) and their ratio (right) with a diffusion model described by Equation (10). The data are from AMS (Aguilar et al. 2015a, 2015b), JACEE (Asakimori et al. 1998), CREAM (Yoon et al. 2011), CREAM-III (Yoon et al. 2017), Tibet ASγ (for HD+SIBYLL; Tibet ASγ Collaboration et al. 2006), and KASCADE (for SIBYLL 2.1; Antoni et al. 2005). Except for the AMS data, the p/He flux ratios as functions of rigidity are obtained with spline interpolation of the corresponding energy spectra and are available as data behind the figure. The corresponding model parameters are given in the first row of Table 1.
(The data used to create this figure are available.)
Other Images in This Article
Copyright and Terms & Conditions
© 2017. The American Astronomical Society. All rights reserved.